What's Up With DeFi Derivatives DEXs
Leverage in financial markets will always have demand, whether equity based assets, commodities, or token based assets. This is a historical trend that has not buckled. Providers of leverage (i.e. exchanges) benefit from this constant stream of demand. While centralized exchanges are the main providers of leverage within crypto markets, over the last couple of years, onchain alternatives like dYdX, GMX, Synthetix, Perpetual Protocol have set out to compete with centralized exchanges, and have been able to establish decent product market fit among “onchain” traders, while offering different trade-offs to using CEXs. It is clear that the demand for leverage can be fulfilled (at some scale) onchain.
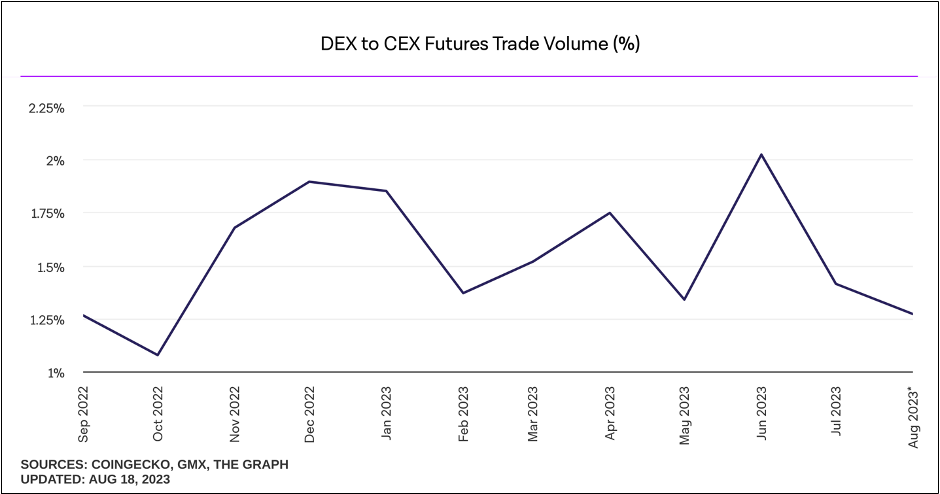
We have seen derivatives DEX volumes start to reflect that trend, and while still a small % of CEX crypto derivatives volumes, the number is growing. DEX volumes topped at around 2% of CEX volumes in June 2023, and have pulled back slightly as volatility and liquidity has largely evaded onchain markets in this period. However, as regulatory pressure piles up on CEXs, even a small movement in volume towards DEXs leave a lot of room for growth and value capture leading into the next few years.
The answer to which of these protocols defines a strong investment, in my opinion, lies with investing in protocols that, in addition to having favourable relative fundamentals, will be able to strongly fit one or more of the following:
a) Scalability
b) Strong/Competitive Mechanism Design
c) Strong Value Accrual to Token or Network
d) Strong Growth Catalysts
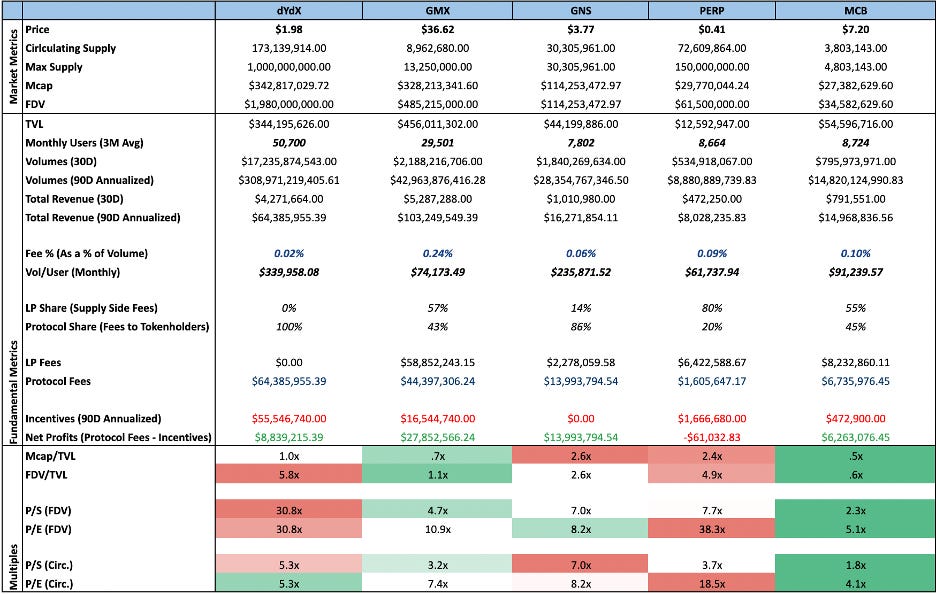
The above snapshot gives us a pretty decent idea of how current derivatives (perp) DEXs within the DeFi space compare to each other at a fundamental level.
dYdX
Data as of 21/08/23
Source: Artemis.xyz
Mechanism Design and Ability to Scale: OB Style DEX
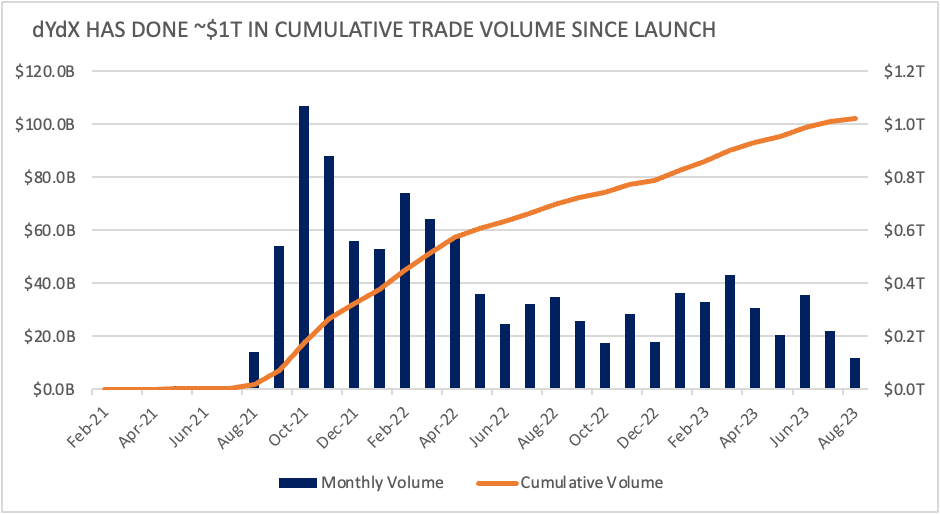
dYdX is the clear market leader in the derivatives DEX space with ~$1T in total volume since launch, roughly ~4x the cumulative trade volume of all onchain “perp” DEXs, which stands at ~$262B. While quite a lot of this volume has been incentivized, dYdX’s success stems from the fact that it runs an orderbook style DEX, which has proven to be the most scalable design for perpetual exchanges (GMX V1, for example, is restricted by the size of GLP). With dYdX v4, the network will move to an app-chain on Cosmos, where validators will run a decentralized offchain order book and matching engine, bringing in even more scale and cheaper fees for users. While in the short run, dYdX may experience a drop in volume (moving away from the EVM tends to do this), however, bridging shouldn’t be too much of a hassle given that CCTP is also integrated with Cosmos. Over the longer term, volumes should trend back to normal levels. Incentives to market makers and traders (while decreasing), should help sustain volumes in the medium term.
Overall, dYdX v3 is the most scalable perp DEX among all on the market, and while v4 will need to prove that it will be able to replicate the same kind of success, it is set up well to absorb (and profit from) large demand, both from retail, as well as institutions.
Value Accrual
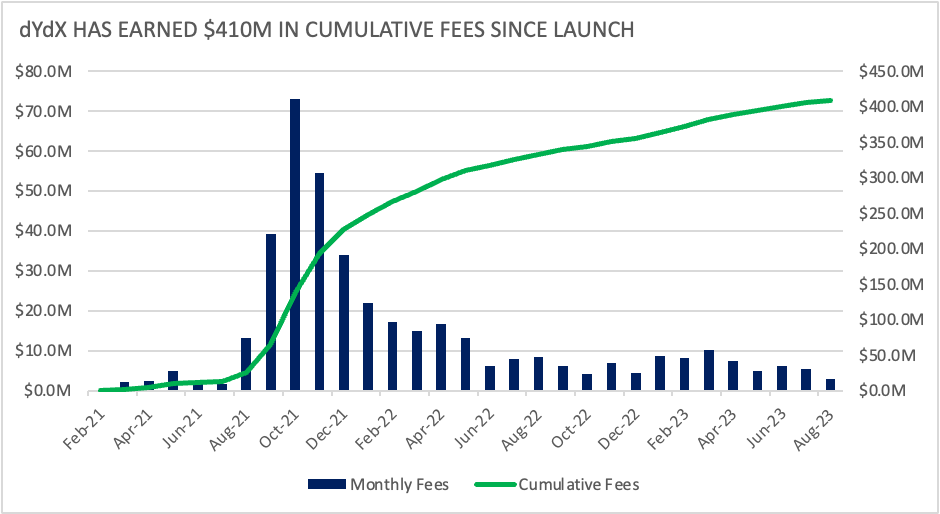
Since inception, dYdX has earned roughly about $409.1M in total revenue. It is key to note that all of this revenue has been accruing to dYdX Trading Inc. (a centralized entity) and not to the dYdX token holders, which has been a point of worry with the dYdX token. However, with dYdX v4, fees will now be routed to validators and stakers (essentially token holders), and given that network security will be an important aspect of token utility, it is likely that close to 50%+ of all revenues will be shared with token holders.
This is a massive boost to value capture of the token, strengthening token utility. On current annualized revenues of $65M, assuming 50% of all fees are shared with token holders, that represents cashflow to token holders of ~$33M, per year, which would, at current prices, translate to ~18% in real yield, assuming 50% of total tokens staked.
Data as of 21/08/23
Source: Artemis.xyz
Over the last year, on average, the take rate (fee as % of total volume) has been 0.024%
Another aspect worth noting is that dYdX has been paying out trading incentives (~$1B in total) in dYdX tokens which has been diluting token holders. This has been necessary to bootstrap the scale of volume and liquidity that dYdX boasts of. What is encouraging to note is that measures are being taken to reduce emissions and incentives, and volume hasn’t seemingly deterred as a result.
Incentives are down -26% over the last 30D.
With dYdX v4, LP rewards scaled will be scaled down ~50%, bringing ~$1m in savings/epoch) and trading incentives will be scaled down to the extent that trading incentives per block cannot exceed the fees generated during that block. This is a massive improvement on the level of inflation arising from emissions historically, as it will help alleviate serious sell pressure.
Overall,
The dYdX token will begin accruing fees with the implementation of V4 (it is still unclear how these fees will be distributed)
dYdX token emissions (trading incentives) have already begun scaling down, and will scale down even further with V4
Added token utility with dYdX V4 (Staking, Validators)
This, in my opinion, represents a serious pull of the lever from dYdX to add much needed value accrual and utility to the token, while ensuring the network isn’t overpaying for liquidity.
Unlocks
The biggest concern with the dYdX token is potential dilution arising due to upcoming unlocks. In Dec 2023, 150M dYdX tokens will become unlocked to Investors and the team, increasing circulating supply to 323m tokens, an 86% increase from levels today. This will add ~$300M to the current market capitalization of the network, and it is likely that we see some sort of dilution arising due to this.
At current prices, It would also change the relative valuation of the network (mcap terms, vs comps), however, one could assign a sovereign chain premium to this valuation, if v4 is able to launch in time. This will be a critical factor to monitor. If v4 is able to launch before the unlock, a case could be made that investors could stake a majority of their unlocked tokens in order to begin earning a share of fees and incentives. Optimally, if v4 isn’t live before the unlock, entering the token post the unlock would be the most logical move.
GMX
GMX has established itself as one of the most popular onchain margin trading protocols within crypto, and looking at overall user retention of the protocol, one could make the case that it is also the most trusted onchain offering available to the market. While volumes over the last few months have been on a decline (especially vs 2022 levels), most of that can be attributed towards receding liquidity within crypto markets in general, coupled with lower periods of volatility and falling asset prices.
Mechanism Design and Ability to Scale: GLP
The GLP pool is the most important component of the protocol. In GMX v1, all trades and swaps on the protocol are dependent on the liquidity available in the GLP pool - since it acts as the counterparty to all the traders on the platform. When the traders make a profit, the GLP pool makes a loss, and when the traders lose, the GLP pool remains stable. The pool consists of a basket of assets (ETH, WBTC, UNI, LINK, stablecoins) that users can trade against and swap. GLP tokens can be minted by depositing any of the assets in the pool, and assets can be redeemed by burning GLP tokens.
Data as of 21/08/23
Source: GMX
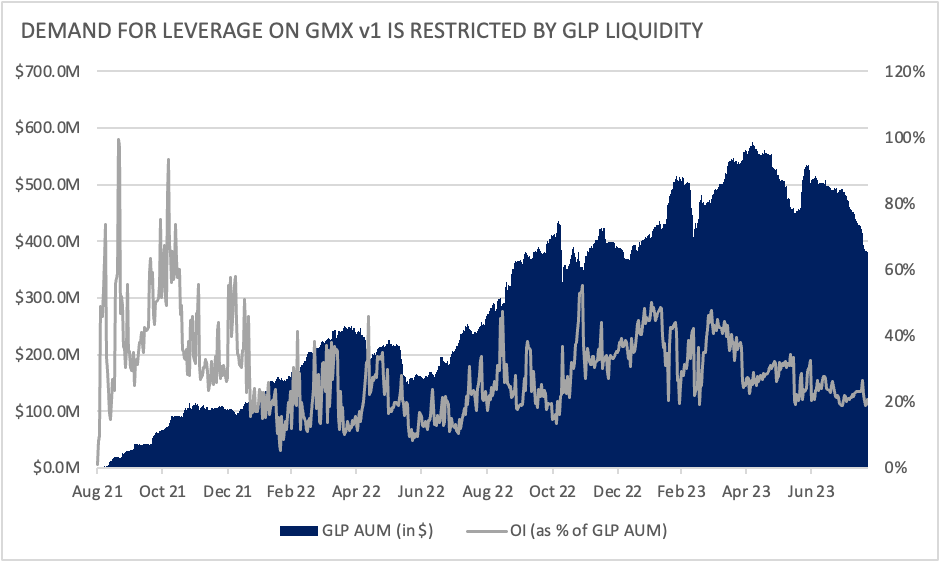
The biggest problem with GMX v1 is its ability to scale. While GLP liquidity has been able to meet demand so far, ultimately, the fact is that the scale of borrowing is restricted by the depth of the GLP (OI is restricted by GLP AUM). However, with GMX v2, the protocol has introduced synthetic assets, and isolated GM pools. While this design will also follow principles like GLP (where LPs are essentially lending liquidity to traders in exchange for fees), it will introduce more asset markets (via synthetics), better risk management for LPs, addition of funding fees in addition to borrow fees, and will look to cater to a slightly different user base.
Data as of 21/08/23
Source: GMX
If you think about it, worrying about meeting demand is a good problem to have for a protocol, as it indicates that demand exists in the first place. GMX v1’s design favours traders looking to execute larger trades (even swaps), as the design prevents traders from facing any slippage and price impact. It Is likely that these traders continue to use GMX v1 to trade ETH and BTC onchain in size.
Over the last year, on average, the take rate (fee as a % of total volume) has been 0.21%, which is ~10x that of dYdX & ~3.5x that of GNS, and yet, it hasn’t deterred volumes.
GMX v1 + GMX v2 in tandem, would allow the protocol to collectively scale by targeting different types of users for different reasons, while also offering additional functionality (ability to trade longer tail assets, more leverage) to existing users.
Value Accrual
GMX has by far been the most value accretive token out there. They essentially kicked off the real yield narrative by offering GMX stakers 30% of all fees earned by the protocol, paid out in ETH (WETH). As long as the protocol continues to churn out healthy volumes, GMX stakers stand to profit.
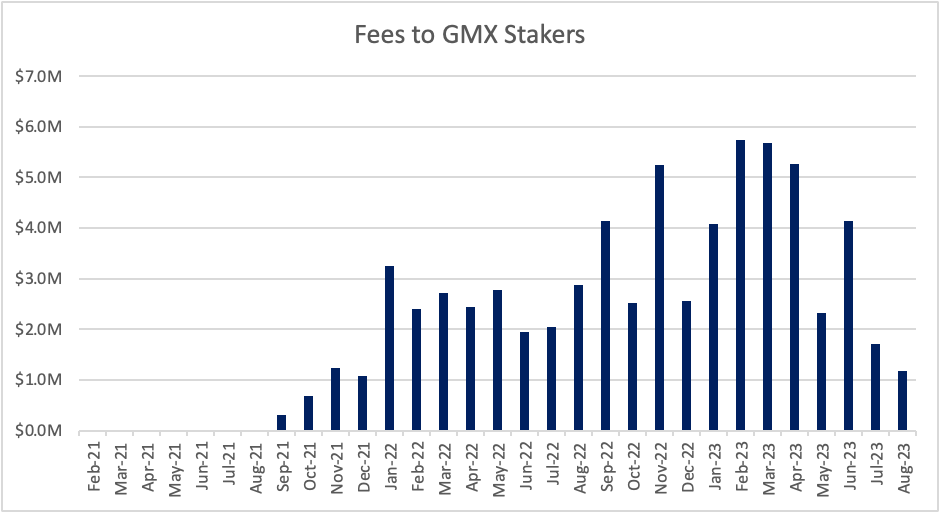
Since launch, GMX stakers have earned ~$68M in fees. At current projected annualized volumes (90D) of ~$43B, GMX stakers will earn roughly $27M in annual cash flows (these can be thought of as a dividend).
Data as of 21/08/23
Source: Artemis.xyz
While fees accruing to GMX stakers has tailed off since the beginning of the year, it is more or less in line with overall liquidity being sucked out of markets. GMX, so far, has had the highest, non-incentivized volumes across perp DEXs as well, which points to the fact that its volumes are sticky, and are likely to return when volatility within markets return
With a current FD P/S ratio of 4.7, GMX is undervalued by the market. The Mean P/S ratio (fully diluted) of its competitors is ~18.7. The only protocol that has a lower FD P/S ratio is MUX protocol; which in my opinion, does not have the levers to achieve a similar kind of growth trajectory that GMX has. With strong value accrual, a distinct user base, the launch of GMX v2, and no real risk of dilution, GMX is relatively cheap at current market prices.
MUX Protocol and Gains Network
Mechanism Design and Scalability
MUX protocol is an interesting product, because it performs two functions. It provides a margin trading platform, with design choices very similar to GMX, where LPs provide liquidity into the MLP Pool (similar to GLP in GMX), and it also acts as a liquidity aggregator for onchain perp platforms, routing trades through Gains Network, as well as GMX to fulfil orders. Gains Network is another product that is built on similar design principles to GMX V1, however, has a wider range of assets to trade, including forex, and offers higher leverage to traders. Trader profits however, are capped at 900%, and traders eat very large spreads while executing orders. This is a big limit to scale.
MUX Market Share: 3.74%
GNS Market Share: 7%
Overall, since both protocols have similar models to GMX v1, I find it slightly unrealistic that they will be able to eat into GMX’s market share, and are, by design, limited by their LP Pools, while GMX is scaling via v2. However, given that Gains has higher leverage, as well as forex trading options, one could make the case that it will attract a specific kind of user base, and it could sustain this user base. Another factor that could see usage of Gains and MCB sustain is that GMX (even with v2) will be limited to some extent, if there is major demand for leverage. Gains and MCB, with similar designs, could fill that void for traders.
Value Accrual
Both MUX and GNS share revenues with token holders, similar to GMX. Combined, the protocols are on track to earn $31m in annualized revenues, and reflect some of the lowest P/S and P/E ratios among peers.
Fees to Token holders (GNS): 30%
Fees to Token holders (MUX): 45%
Token economics are slightly different for MUX (which has ve token economics, where MCB stakers have to lock tokens in order to earn protocol revenue). Given that GMX and GNS stakers can choose to unstake their tokens whenever they choose to, (at the cost of multiplier points) highlights the weakness of the ve token design choice in this scenario. It makes the MCB token less attractive to hold.
Both MUX and GNS have unique offerings that make strong cases for why they could see sustained usage, amid returning demand for leverage. Looking at the P/S (2.3 for MCB, 7 for GNS) and P/E (5.1 for MCB and 8.2 for GNS) multiples for both protocols, they are the two most undervalued tokens in the onchain perp DEX sector, relative to their peers.
Scenario Analysis and DCF Models
While the market snapshot above (competitor analysis section) may make certain protocols look relatively overvalued/undervalued compared to their peers, it is important to note that current volumes are also a function of liquidity, volatility, incentives and overall market conditions, which have all been on a contraction over the last year or so. However, these protocols have proved strong market fit, and are the most likely to be able to see volumes return to 2022 levels and beyond amid sustained growth over the next few years, as market conditions get better, and volatility increases.
We will forecast what growth could look like for these protocols, and look at valuing these tokens based on future cashflows amid various growth scenarios. First, we will try to get a sense of what volumes we could expect under various scenarios.
Scenario 1: DEXs hit ~10% of CEX volumes by 2028 (Total volume stays constant): $1.2T
Scenario 2: DEXs hit ~5% of CEX volumes by 2028 (Total volume: +50% by 2028): $960B
Scenario 3: DEXs hit ~50% of CEX volumes by 2028 (Total volume: +100% by 2028): $11.6T
dYdX
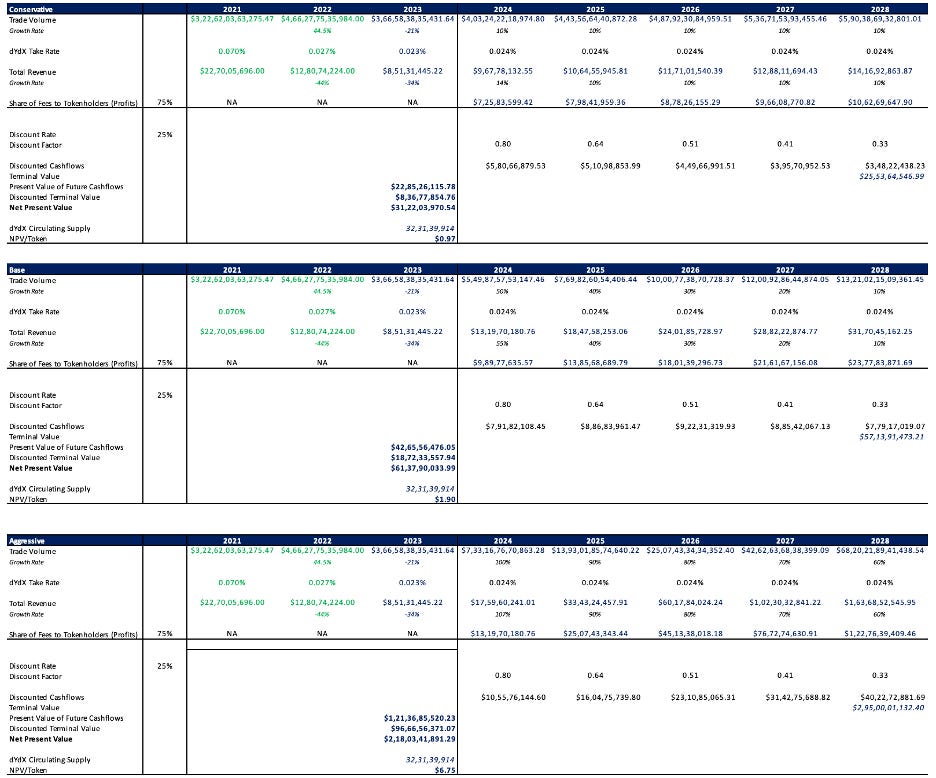
Model takes into consideration a 150M supply unlock in Dec 2023 (which will increase circulating supply by ~86% from time of writing)
Base Case Implied price more or less aligns with current market prices ($1.98), which gives us some indication that the market estimates volumes could return to 2022 levels, and higher
Model assumes that 75% of all fees generated by protocol are shared with token holders, 25% reserved for OpEx, marketing, treasury fund
Model doesn’t consider incentives as a cost (since it dilutes token holders and current emissions are likely priced in)
GMX
Once again, Base Case Implied price more or less aligns with current market prices ($36.4), which again, gives us some indication that the market estimates volumes could return to 2022 levels, and higher. High upside potential, aggressive case estimates GMX FDV at $1.45B
GNS
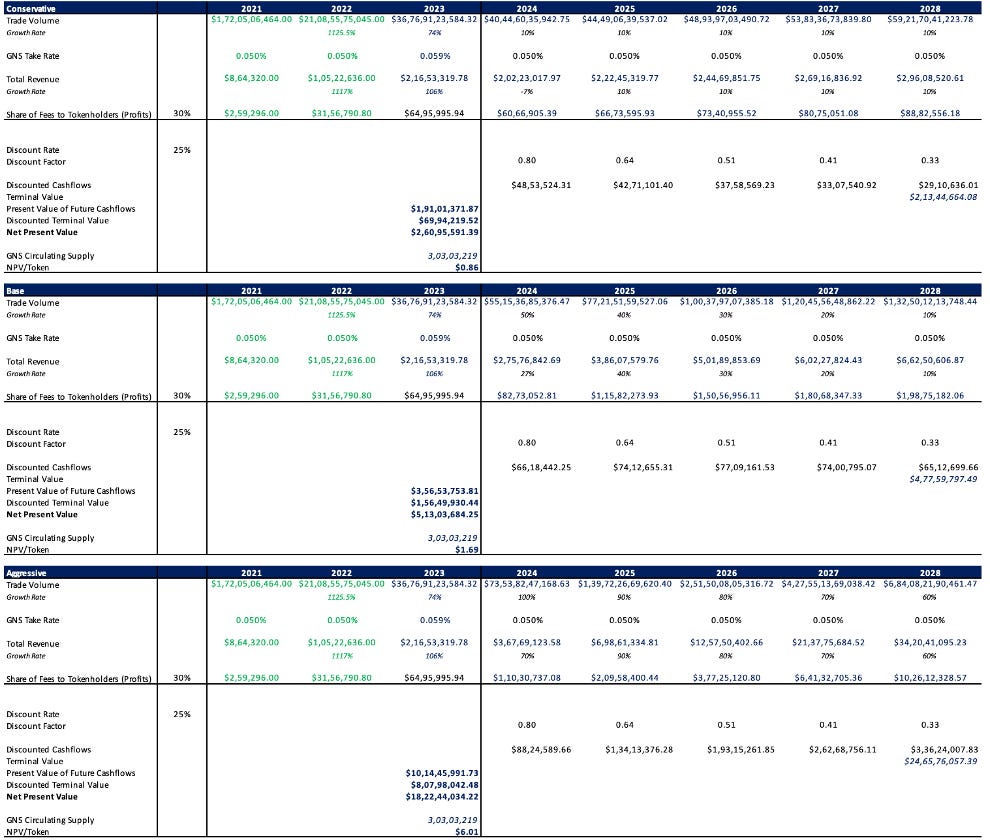
Despite low P/S and P/E ratios vs its peers, fee generation from Gains doesn’t seem to be enough at this point to warrant an allocation. Fees would need to increase 2x (0.05% to 0.1%), which would likely deter users (who are already paying with wide spreads). Model shows token is more or less overvalued and there is lower upside potential.
MUX Protocol
Lowest P/S and P/E ratios vs its peers, MCB’s ve-token design seems to be a roadblock for strong market attention (investors would rather hold and stake GMX), however, MCB has a solid product and could find steady streams of demand. Enough upside potential to warrant a small allocation.
Perpetual Protocol
Poor P/S and P/E ratios vs all peers in the perp DEX sector, unlikely that the protocol will be able to compete with incumbents like dYdX, GMX or Synthetix, and current metrics do not point to any sign of rapid, near term growth. Add to this poor value accrual to the PERP token, and negative net protocol earnings, Perpetual protocol has a long road to climb in order to even begin competing with the rest.

